Small cap stocks may be on the brink of an upward trend, bolstered by four key factors that have historically driven strong returns in this asset class.

Falling interest rates
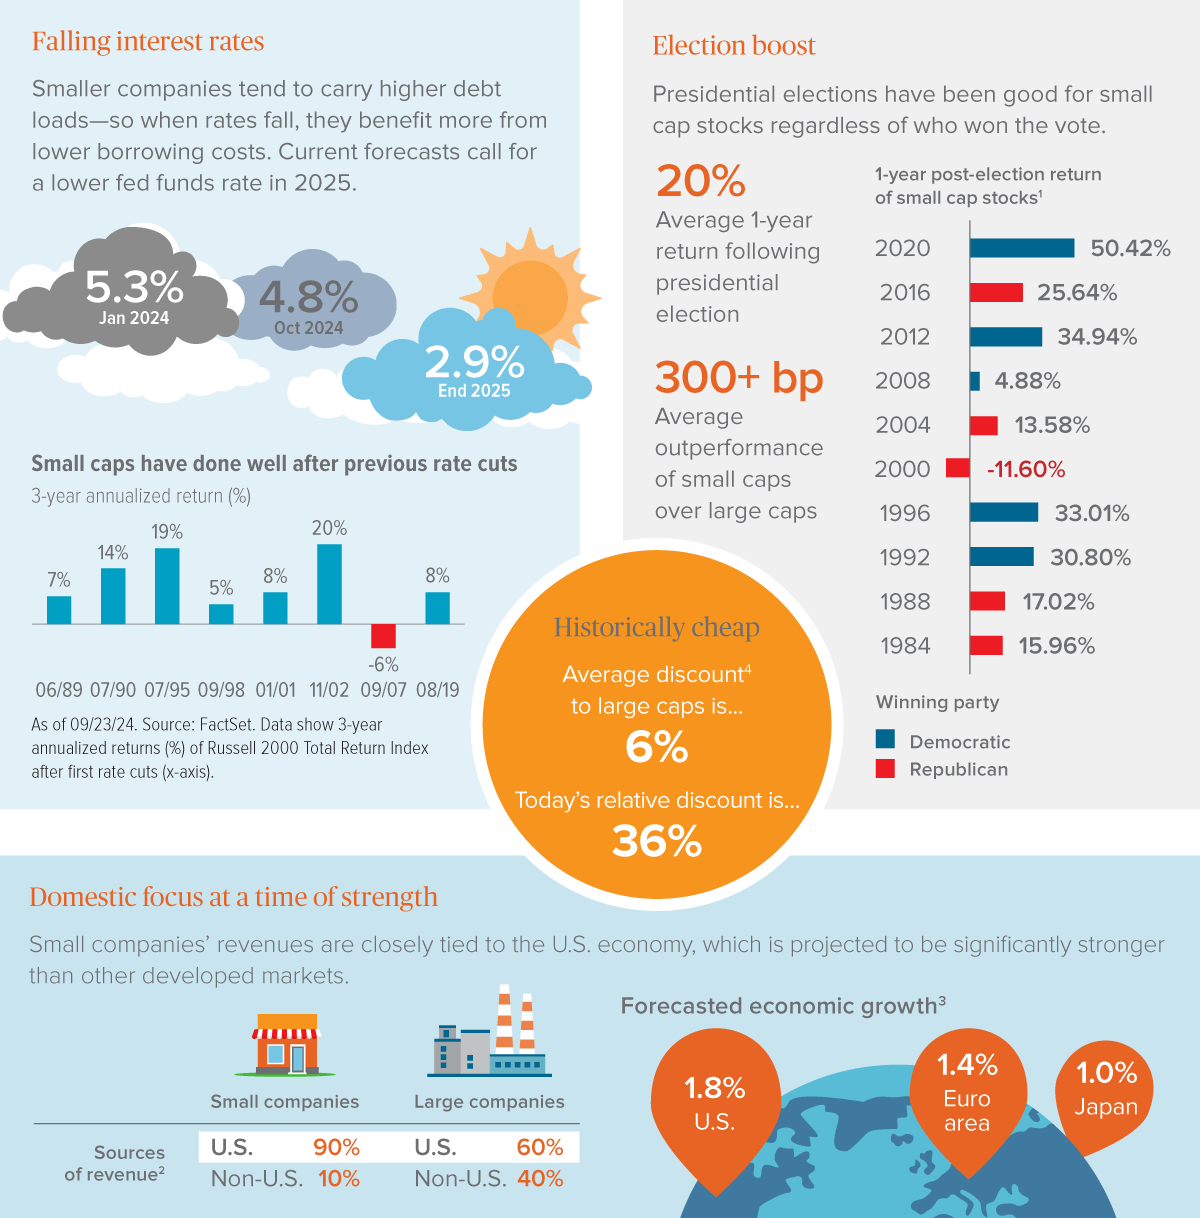
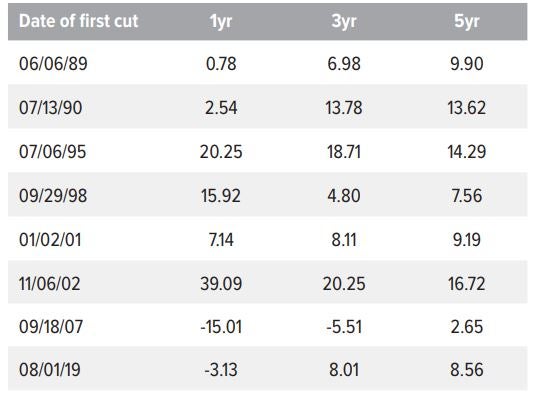
Smaller companies tend to rely more on short-term loans and floating-rate debt, which means they may benefit more from refinancing opportunities as interest rates fall. Over the next 12 months, the effective federal funds rate is expected to decrease from 4.8% to the perceived neutral rate of 2.9%.5 Historically, rate-cutting cycles have been associated with strong performance for small cap stocks (Exhibit 1).

As of 09/23/24. Source: FactSet. Data show annualized returns after dates of first rate cuts for the Russell 2000 Total Return Index. Small cap stocks are stocks of small companies.
Domestic focus at a time of strength
Whereas many larger companies have significant overseas operations, smaller companies generate 90% of their revenues, on average, right here in the U.S.2 This means they stand to gain from the relative strength of the U.S. economy over the next several years compared to other developed nations. U.S. GDP growth is projected to hit 2.5% in 2024, followed by 1.8% in both 2025 and 2026. Conversely, the Euro area is on track for 1.4% and 1.3%, while Japan is expected to deliver 1.0% and 0.9% over the next two years.3
Election boost
Small cap stocks have a history of delivering impressive returns following presidential elections, no matter which party comes out on top (Exhibit 2, left side). Part of the reason may be that the first year of new administrations focuses on fiscal initiatives that deliver on campaign promises. Two notable exceptions were the tech bubble and the global financial crisis—and even during the financial crisis, markets bounced back and moved into positive territory within a year of the election.
Moreover, small cap returns have historically outpaced large caps after elections (Exhibit 2, right side). While large caps have had their moments, small caps have outperformed by an average of roughly 300 basis points over the 12 months following elections.

As of 09/30/24. Source: FactSet, Voya IM. Left side: Data show the annualized daily returns after election day for the Russell 2000 Total Return Index. Right side: Data show the average difference between the returns of the Russell 2000 Total Return Index (small caps) and the Russell 1000 Total Return Index (large caps) over the specified periods.
Historically cheap
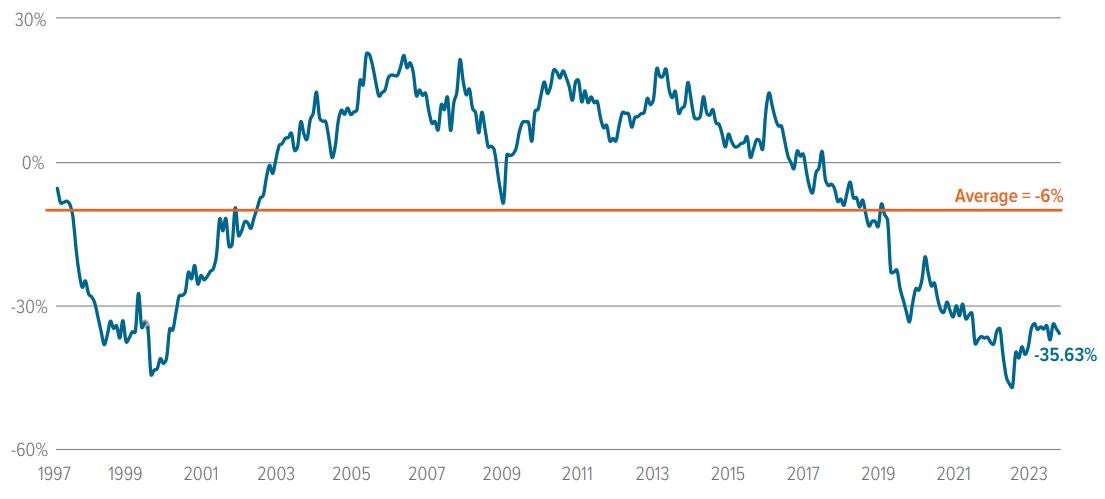
U.S. small cap stocks typically trade at a slight discount to their large cap counterparts (Exhibit 3).4 Right now, however, that discount is unusually steep. These kinds of discounts don’t happen often, but they can last for quite some time when they do occur. For instance, during the tech bubble, a similar discount lasted for about 2.5 years, from November 1999 to March 2002, with small caps trading at 20% or more below large caps.
The current period of high discounts has been going on for about 4.5 years, starting in early 2020. While the passage of time alone doesn’t indicate an imminent reversal, we believe the current macroeconomic and geopolitical landscapes—falling interest rates, higher U.S. economic growth and the presidential election—could be a signal that this discount may narrow.

As of 09/30/24. Source: Morningstar Direct. Data show the next twelve months price-to-earnings multiple of the Russell 2000 TR Index relative to the Russell 1000 TR Index.
A note about risk
The principal risks are generally those attributable to investing in stocks and related derivative instruments. Holdings are subject to market, issuer and other risks, and their values may fluctuate. Market risk is the risk that securities or other instruments may decline in value due to factors affecting the securities markets or particular industries. Issuer risk is the risk that the value of a security or instrument may decline for reasons specific to the issuer, such as changes in its financial condition. More particularly, the strategy invests in smaller companies which may be more susceptible to price swings than larger companies because they have fewer resources and more limited products, and many are dependent on a few key managers.
