Fixed Income Perspectives: A Buy-the-Dip Opportunity?

Eric Stein, CFA
Chief Investment Officer

U.S. economic growth is expected to slow this year, and the risk of a recession has certainly risen. While credit spreads have widened from historically tight levels, they are not flashing warning signs. Is this a buy-the-dip moment?
The 2025 GDP growth forecast, which began the year at ~2.7%, has declined to ~1.8%, far below the 3.2% and 2.5% growth rates from 2023 and 2024, respectively.1 Some forecasts are even calling for a recession starting as early as the third quarter of this year. The worse-than-expected tariffs announced earlier this month (many of which have been temporarily reduced) have dampened growth expectations. Businesses have paused investment, and consumers have pulled forward spending due to heightened uncertainty and the expectation for higher prices in the future.
While a recession this year is not our base case, we expect growth will slow to below-trend levels. In this environment, spread sectors have historically delivered positive excess returns by outperforming Treasury bonds.
Credit: Positive relative returns, even with slowing growth
Credit spreads reflect lenders’ view of borrowers’ ability and willingness to repay debt. At a basic level, if growth remains positive, most borrowers will continue to pay their coupons, helping to drive bond returns. For example, even at zero real growth, investment grade credit has historically delivered a positive average excess return (Exhibit 1).
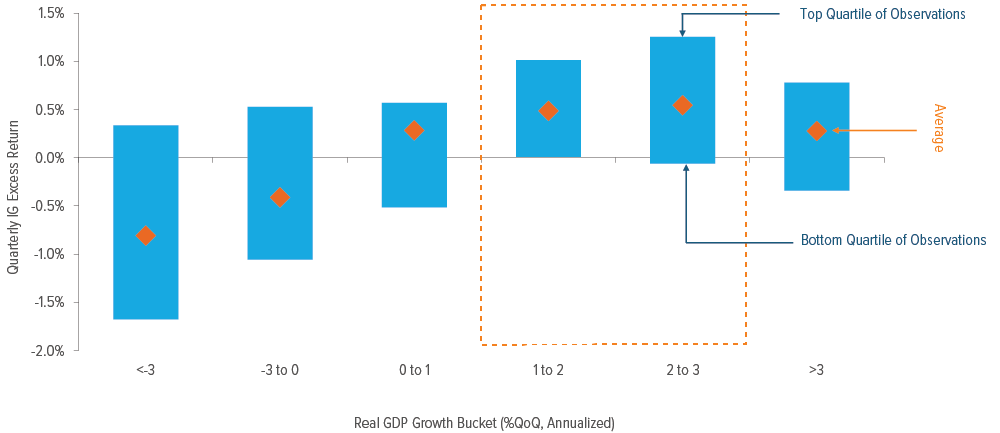
As of 12/31/24. Source: Morgan Stanley. ICE BofA Corporate Index represents investment grade (IG) credit excess returns over the like-duration treasury bonds from 1948 through 2024.
Even though credit spreads have widened recently from near record-tight levels, they remain well below recessionary levels. Instead, we believe this spread reaction has been about repricing growth expectations, which doesn’t necessarily warn of an impending recession. Historically, spreads on investment grade corporate bonds widen to at least 160 basis points (bp) and high yield spreads gap north of 800 bp when flashing a recession warning. This year, investment grade has peaked at 119 bp while high yield has reached 453 bp, both of which are near or below the median spread levels for the past 25 years.2
A buy-the-dip opportunity?
Despite the wider spreads, fundamentals have remained resilient: Overall, U.S. corporations are entering the expected slowdown from a point of strength, which should help them weather the storm. Investment grade credit metrics look solid—revenue, operating profit (EBITDA), and margins are all at elevated levels; leverage is stable; and debt growth has been low. Management teams built financial stability by staying disciplined following the fears of an imminent recession in 2022. As a result, upgrades have outpaced downgrades and fallen angels have been minimal over the last few years.
High yield fundamentals are also on solid footing, albeit less so than investment grade (as expected). Our base case is for modestly wider spreads and average defaults. In this case, return estimates are roughly 6.6% (Exhibit 2). We also modeled a breakeven scenario of delivering near zero returns. In this scenario, defaults would double and spreads would widen significantly. This analysis shows that current income shields returns even if the market turns more negative from here.
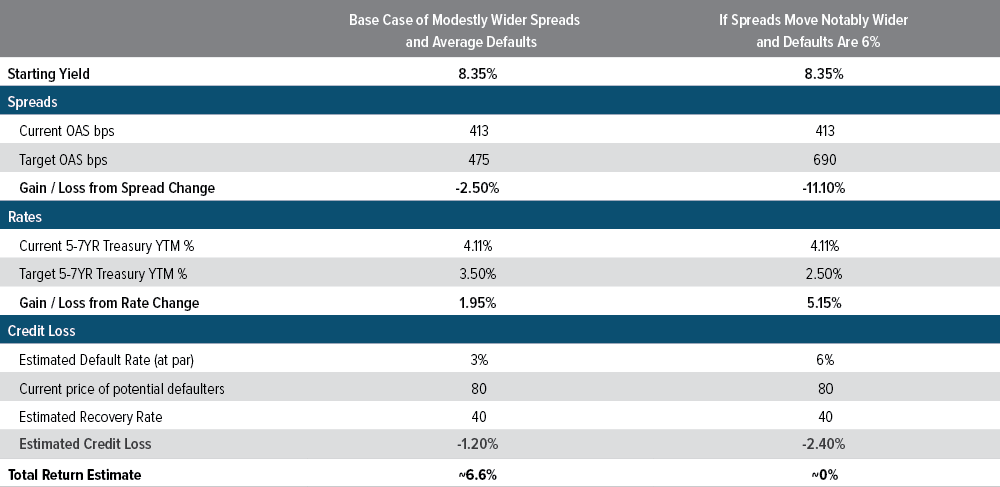
As of 04/21/25. Source: Voya IM; Bloomberg; Estimated data using assumed spread duration of 4 years and modified duration to worst of 3.2 years. High yield represented by the Bloomberg U.S. High Yield Corporate 2% Issuer Cap Index. Past performance is no guarantee of future results. See disclosure for glossary of terms.
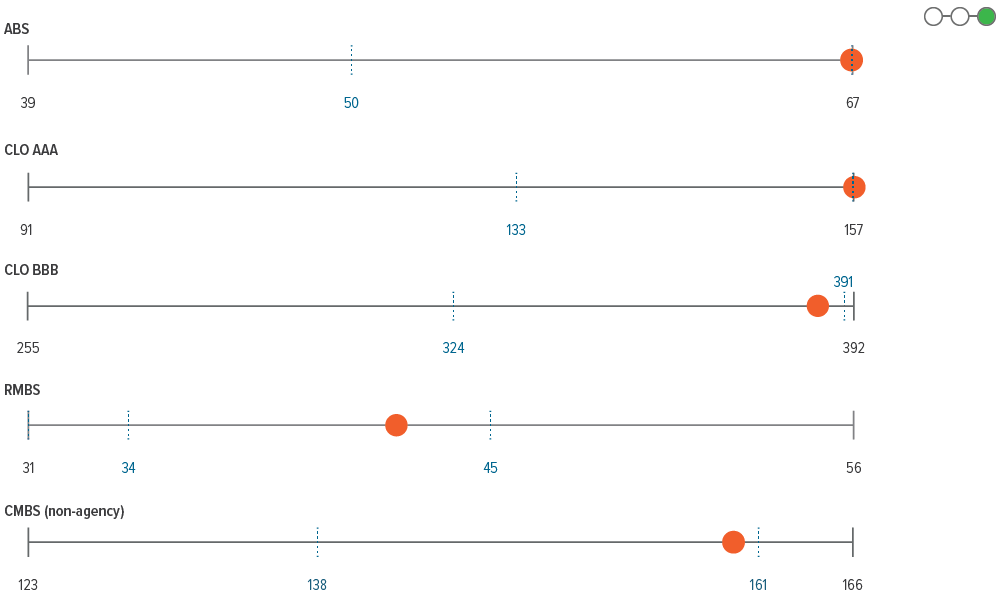
Sentiment has also weakened across securitized credit sectors, which is reflected in wider spreads across all subsectors. Some—such as subprime auto and conduit CMBS subordinate bonds—have reached their widest levels in 12 months. However, yield levels remain attractive overall and should soften the blow if the economic picture degrades further.
Despite these strong underlying fundamentals, forward guidance will be the key indicator to watch (given the uncertainty and risks to growth and consumption from tariffs). Although we had been waiting for spreads to widen and valuations to become more attractive, we believe there may be more volatility ahead. We will remain patient and look for opportunities to add incremental high-quality credit risk as valuations improve.
As of 04/16/25. Source: Bloomberg, FactSet, Voya IM.
As of 03/31/25. Sources: Bloomberg, JP Morgan, Voya IM. See disclosures for more information about indexes. Past performance is no guarantee of future results.
Sector outlooks

- IG spreads widened 7 bps in March as the late February risk off move continued. Rates traded in a wide range, supporting spreads at the highs, but ending at new YTD lows which hurt demand and inflows to end the month.
- Overall fundamentals are in good shape for a potential slow down. The macro picture is less supportive, with activity slowing given uncertainty over tariffs.
- We’re keeping IG risk low into this move wider which we think will have legs, but plan to add incrementally as valuations improve.

- In our base case of an eventual policy pivot, we see spreads retracing to 300, whereas sustained policy upheaval would likely push OAS wide of 400. The sell-off of the last two months has pushed spreads to the middle of that range.
- All-in yields are likely sufficient to attract capital, but equity market weakness creates a headwind for risk appetite.
- If tariff tensions ease, spreads are likely to be tighter in the next six months, but the risk of negative sentiment in real activity is increasing and leaving the distribution of spread outcomes more balanced

- The overall carry should continue to boost performance on both a total return and excess return basis.
- The share of loans priced at par or higher decreased last month, as did the total repricing volume and total supply.
- Longer term, we remain relatively constructive on the 2025 outlook for the asset class. With only 2–3 rate cuts, the all-in carry should return to the historical average; however, there is a risk of a more substantial cutting cycle if the economy weakens more than expected

- Prepay speeds are mostly consistent and stable across the coupon stack, offering opportunities for relative value trades.
- Both OAS and ZV are slightly tighter than their rolling 12mo averages across the coupon stack.
- Elevated rates will lead to low cash-out refis and a subdued housing market dampening supply throughout the year. Current projections place 2025 net supply roughly in line with 2024.
- The fiscally improved profile of the U.S. consumer is in place, although the low-income cohort is challenged. We expect relief over the course of 2025 as inflation slows, rates decline, and growth remains positive.
- Low perceived risk against slightly wider spreads and a flat yield curve should continue to foster a positive valuation assessment, driving our positive rating for ABS.
- CMBS cheapness remains evident with non-benchmark sectors also offering compelling relative value. As financial conditions remain easy, metrics across property types should continue to improve.
- Some recent spread widening and continued bull flattening have pushed yield differentials in CLOs’ favor, at least for the moment. This increases our relative value assessment. However, market participants have been revising default estimates up for leveraged loans, albeit modestly.

- The growth outlook is modest, corporate fundamentals remain resilient, and financial policy remains prudent. However, elevated trade uncertainty limits our enthusiasm.
- Absolute yield levels remain attractive relative to historical levels despite the recent rally.
- New deals were well absorbed indicating still-healthy investor demand given elevated yield levels. Issuance is expected to remain below trend in April.
Glossary of terms |
A note about risk: The principal risks are generally those attributable to bond investing. All investments in bonds are subject to market risks as well as issuer, credit, prepayment, extension, and other risks. The value of an investment is not guaranteed and will fluctuate. Market risk is the risk that securities may decline in value due to factors affecting the securities markets or particular industries. Bonds have fixed principal and return if held to maturity but may fluctuate in the interim. Generally, when interest rates rise, bond prices fall. Bonds with longer maturities tend to be more sensitive to changes in interest rates. Issuer risk is the risk that the value of a security may decline for reasons specific to the issuer, such as changes in its financial condition.