Weekly Notables
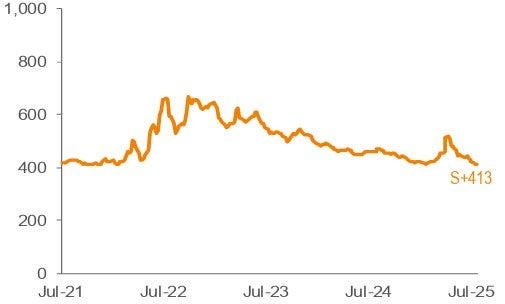
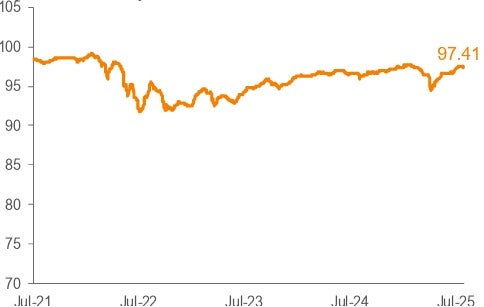
While new tariff headlines resulted in a modest pickup in volatility across most risk assets, the loan market continued to firm this week. The Morningstar LSTA US Leveraged Loan Index (Index) gained 0.28% for the seven-day period ended July 10. Most of the gain was driven by the change in the market value component of returns, with the average Index bid price advancing by 24 basis points (bps) to 97.43.
In the primary market, new-issue activity accelerated following last week’s holiday-induced lull. Arrangers launched a total of $11.6 billion in volume with a healthy mix of M&A, refinancings and dividend recapitalizations. With the improvement in trading levels, repricing activity also made a meaningful return, as $19.1 billion was repriced across 13 transactions. Looking ahead, net of approximately $31.1 billion of anticipated repayments that aren’t associated with the forward calendar, repayments outstrip supply by roughly $15.2 billion this week, compared to repayments outstripping supply by $17.2 billion last week.
Loan prices in the secondary market continued to firm this week. Across rating categories, lower-rated segments of the market generally outperformed, as risk appetite remains healthy. Looking at investor demand, CLO managers issued three new deals this week. This brings the YTD tally to a robust $104.5 billion. Retail loan funds posted a $97 million inflow for the week ended July 9, extending the inflow streak to three weeks. Flows were led by exchange-traded funds (ETFs), as mutual funds experienced a modest net withdrawal.
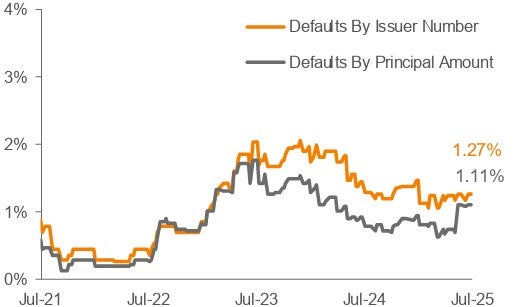
There were no defaults in the Index this week.


Source: Pitchbook Data, Inc./LCD, Morningstar ® LSTA ® Leveraged Loan Index. Additional footnotes and disclosures on back page. Past performance is no guarantee of future results. Investors cannot invest directly in the Index. *The Index’s average nominal spread calculation includes the benefit of base rate floors (where applicable).
Monthly Recap: June 2025
The loan market had another solid month, as broader risk sentiment continued to firm on the back of stable economic data and easing geopolitical concerns. Against this backdrop, the Index gained 0.80% in June, bringing the YTD return to 2.81%. Secondary loan prices, as represented by the weighted average bid price of the Index, increased by 16 bps, closing out the month at 97.07.
One notable theme in June was the return of risk appetite, as lower-rated credits outperformed. For context, BBs, Bs, and CCCs registered respective returns for the month of 0.72%, 0.87%, and 1.11%. However, YTD performance remains in favor of BB-rated loans, which fared better during April’s declines.
The primary market was busier this month, as arrangers launched a bevy of new deals, including both refinancings and M&A. Total institutional volume (ex-repricings) hit a four-month high of $44.1 billion. In addition, repricings returned after a two-month reprieve given the volatility-induced weakness experienced in April, with roughly $28 billion of loans repriced during the month. On the demand side, CLO issuance remained healthy at $15.4 billion, although it downshifted from the robust pace seen last month at over $20 billion. YTD supply is nearly tacking last year’s record pace at roughly $100 billion. Retail inflows were a modest $250 million, which brings the consecutive streak of inflows to 2 months. However, YTD flows remain negative given April’s sizable outflows.
Traditional default activity increased in June following the default of Altice France, which is a large issuer within the Index. As a result, the trailing 12-month default rate by principal amount moved up to a still modest 1.11%, from 0.74% in May. Including LMEs, the loan default rate ended the month at 4.46%, slightly up from 4.36% in May, but still off the recent high of 4.7% from December 2024.

Source: Pitchbook Data, Inc./LCD, Morningstar ® LSTA ® Leveraged Loan Index. Additional footnotes and disclosures on back page. Past performance is no guarantee of future results. Investors cannot invest directly in the Index. *The Index’s average nominal spread calculation includes the benefit of base rate floors (where applicable)