With the rotation toward value supported by sustainable catalysts, now is a good time to consider rebalancing portfolios that have become heavily overweighted to growth.
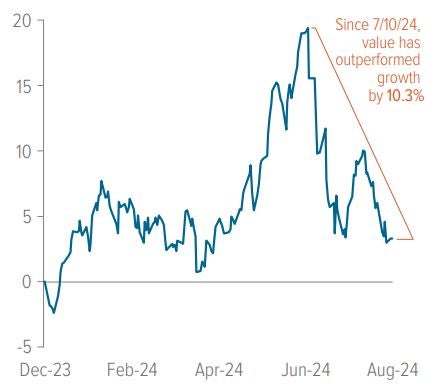
Following a dominating first-half performance by mega cap growth stocks, value stocks have made a comeback, significantly narrowing the performance gap since July (Exhibit 1). The turning point came when Federal Reserve Chair Jerome Powell hinted at an openness to rate cuts during his Congressional testimony on July 9-10. The fact that the Fed could begin easing even with inflation above its 2% target signaled a shift in priority from reining in consumer prices to achieving a soft landing.

As of 09/10/24. Source: FactSet. Growth represented by the Russell 1000 Growth Index and value represented by the Russell 1000 Value Index. Data shows the relative cumulative return between growth and value year-to-date.
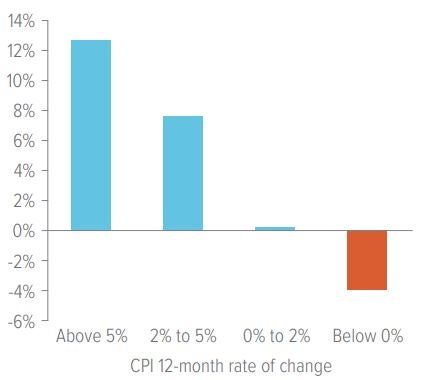
The Fed’s growing comfort with a higher-than-normal inflation rate may bode well for value stocks (Exhibit 2). Nearly 100 years of data show that when inflation was 2% or greater, value stocks outperformed growth stocks by a significant margin.

As of 05/23. Source: Robert Shiller, Kenneth French. Value premium over growth is the difference in annualized returns since 1926 between 10% of stocks with the highest book to market ratios and the 10% with the lowest.
Is the value rotation sustainable?
We see structural trends that should keep inflation above 2%, providing additional support for value stocks:
1. Continuing deglobalization, which historically has led to higher business costs (inflation) and lower growth
2. Increasing investment in green tech, which is driving up costs for materials, infrastructure and labor
3. Higher (but manageable) wage growth, as labor demand outstrips supply, primarily due to immigration policy and the Covid-era trend of workers taking early retirement
In the near term, lower interest rates generally benefit economically sensitive industries—which typically fall into the value category—by spurring more business and consumer activity. For example, consumers are more likely to buy a house or car if rates are lower.
Election years tend to favor the value factor
According to a Barclays analysis of the last 10 presidential elections, the value factor outperformed growth by an average of over 1000 basis points 12 months after elections (Exhibit 3). We believe that despite the strong performance of value stocks since July, the underlying drivers for value remain intact.
This is a good opportunity for investors to review their portfolios to determine if the extreme concentration in U.S. equity markets has affected their allocation balance—potentially warranting a shift to value.

As of 08/20/24. Source: LSEG Data & Analytics, Bloomberg, Barclays Reseach. “Factor Findings: Rate Cuts and Elections.” Barclays U.S. long/short factors are sector-capped at 20%. History has been extended to 1984 when possible, covering 10 U.S. elections. Large/small shows the performance spread between large and small cap stocks where a negative (positive) return means small (large) outperformed large (small).
A note about risk
The principal risks are generally those attributable to investing in stocks and related derivative instruments. Holdings are subject to market, issuer and other risks, and their values may fluctuate. Market risk is the risk that securities or other instruments may decline in value due to factors affecting the securities markets or particular industries. Issuer risk is the risk that the value of a security or instrument may decline for reasons specific to the issuer, such as changes in its financial condition.

